Piny vs Text2Infographic
Both tools are evenly matched across our comparison criteria.
Rating
Neither tool has been rated yet.
Popularity
Text2Infographic is more popular with 19 views.
Pricing
Piny is completely free.
Community Reviews
Both tools have a similar number of reviews.
| Criteria | Piny | Text2Infographic |
|---|---|---|
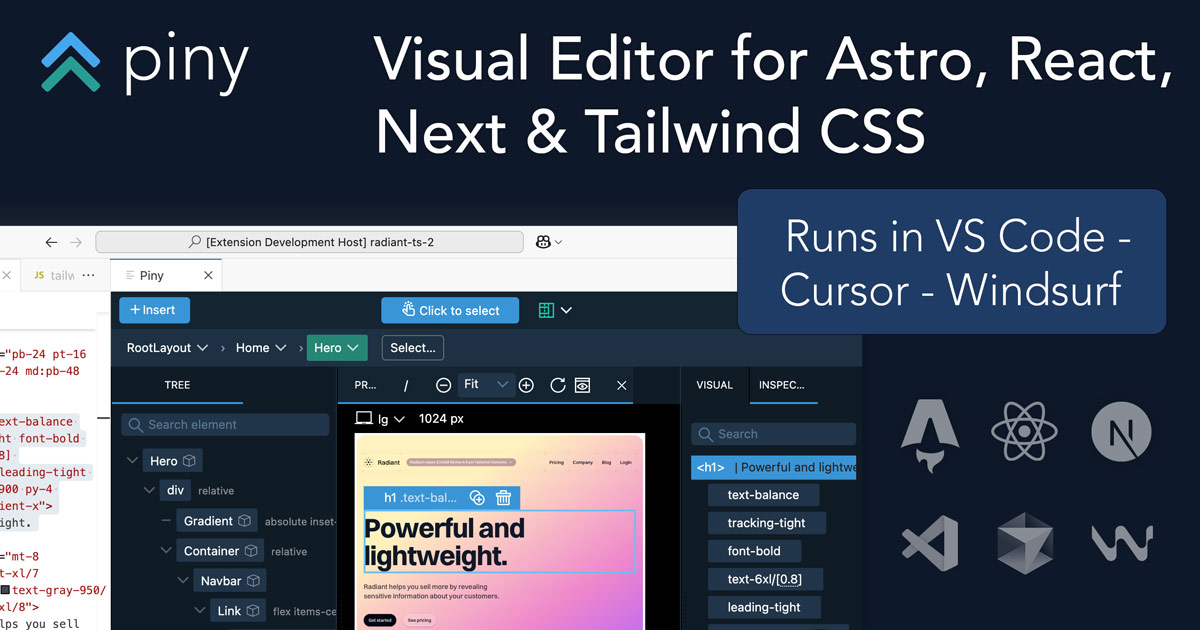
| Description | Piny is an innovative in-IDE visual editor designed to streamline UI development for modern web frameworks like Astro, React, Next.js, and Tailwind CSS. It empowers developers to directly edit components visually within their VS Code environment, dramatically accelerating the UI building process. By offering a live preview and writing changes directly to the codebase, Piny minimizes context switching and fosters seamless collaboration between designers and developers, making it a powerful tool for rapid front-end development and maintaining design system consistency. | Text2Infographic is an innovative AI-powered tool designed to streamline the creation of stunning visual infographics from raw text. It intelligently summarizes input content and generates relevant images, significantly reducing the time and effort typically required for graphic design. This platform empowers users, regardless of their design expertise, to transform complex information into engaging, easy-to-understand visuals for various communication needs. |
| What It Does | Piny functions as a VS Code extension that provides a visual editing interface for web components. Developers can open their existing Astro, React, or Next.js projects and visually interact with components, modifying their props, children, and Tailwind CSS styles through a user-friendly GUI. All visual manipulations are translated directly into clean, readable code within the developer's files, eliminating the need for manual code translation from design mockups. | The tool's core functionality involves taking user-provided text, applying AI to summarize the key points, and then generating appropriate visual elements and layouts. Users can then extensively customize these AI-generated infographics, adjusting text, colors, fonts, icons, and overall design to match their brand or message, before exporting the final product. |
| Pricing Type | free | freemium |
| Pricing Model | free | freemium |
| Pricing Plans | Beta Access: Free | Free: Free, Basic: 19, Pro: 39 |
| Rating | N/A | N/A |
| Reviews | N/A | N/A |
| Views | 13 | 19 |
| Verified | No | No |
| Key Features | Direct Visual Component Editing, Real-time Live Preview, Multi-Framework Support, Native VS Code Integration, Automatic Code Generation | AI Content Summarization, AI Image Generation, Extensive Customization Options, Pre-designed Templates Library, Multiple Export Formats |
| Value Propositions | Accelerated UI Development, Reduced Context Switching, Improved Designer-Developer Handoff | Time-Saving Infographic Creation, No Design Skills Required, Transform Complex Information |
| Use Cases | Rapid UI Prototyping, Building Component Libraries, Implementing Design Systems, Iterating on Existing UIs, Onboarding New Developers | Marketing Content Creation, Educational Material Development, Business Report Summarization, Research Findings Visualization, Social Media Visuals |
| Target Audience | Piny is primarily designed for frontend developers, UI/UX engineers, and full-stack developers working with Astro, React, Next.js, and Tailwind CSS. It's particularly beneficial for teams focused on rapid prototyping, maintaining design systems, and improving collaboration between design and development. Agencies and in-house development teams seeking to accelerate UI iteration cycles will find significant value. | This tool is ideal for marketers, content creators, educators, business professionals, and students who need to present data or complex information visually and efficiently. Anyone looking to create professional-looking infographics quickly, without extensive design skills, will find Text2Infographic highly beneficial. |
| Categories | Design, Code & Development, Business & Productivity, Automation | Text Summarization, Image Generation, Design, Data Visualization |
| Tags | visual editor, vs code extension, frontend development, react, next.js, astro, tailwind css, ui building, code generation, developer tools | infographic generator, ai summarization, data visualization, visual content, content marketing, design tool, ai images, graphic design, text to image, presentation tool |
| GitHub Stars | N/A | N/A |
| Last Updated | N/A | N/A |
| Website | getpiny.com | text2infographic.com |
| GitHub | N/A | N/A |
Who is Piny best for?
Piny is primarily designed for frontend developers, UI/UX engineers, and full-stack developers working with Astro, React, Next.js, and Tailwind CSS. It's particularly beneficial for teams focused on rapid prototyping, maintaining design systems, and improving collaboration between design and development. Agencies and in-house development teams seeking to accelerate UI iteration cycles will find significant value.
Who is Text2Infographic best for?
This tool is ideal for marketers, content creators, educators, business professionals, and students who need to present data or complex information visually and efficiently. Anyone looking to create professional-looking infographics quickly, without extensive design skills, will find Text2Infographic highly beneficial.