Ezinsights AI vs Text2Infographic
Text2Infographic wins in 2 out of 4 categories.
Rating
Neither tool has been rated yet.
Popularity
Text2Infographic is more popular with 19 views.
Pricing
Ezinsights AI uses paid pricing while Text2Infographic uses freemium pricing.
Community Reviews
Both tools have a similar number of reviews.
| Criteria | Ezinsights AI | Text2Infographic |
|---|---|---|
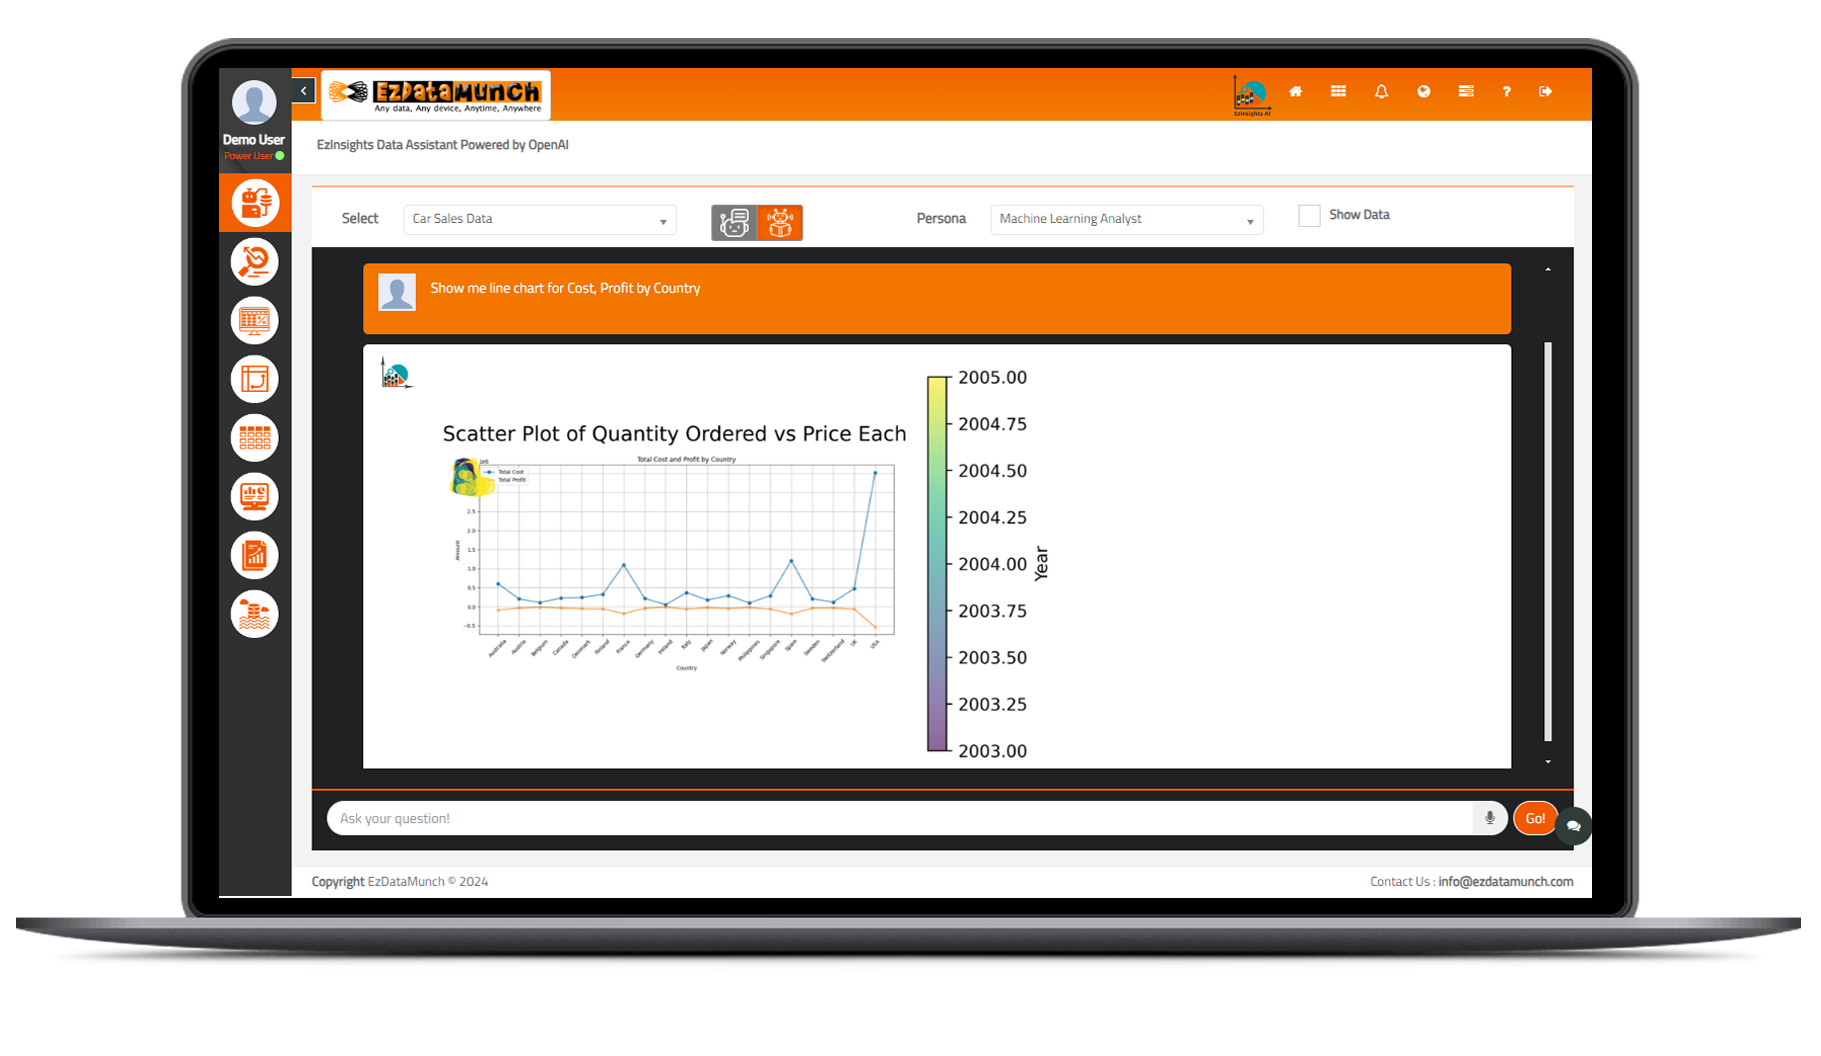
| Description | Ezinsights AI is an innovative no-code AI platform designed to transform raw business data into instant, actionable insights using natural language processing (NLP) and generative AI. It empowers business users, regardless of their technical proficiency, to query complex datasets by simply asking questions in plain English, thereby democratizing advanced data analytics. The tool aims to accelerate decision-making by providing accurate answers, interactive visualizations, and prescriptive recommendations, eliminating the traditional barriers of data analysis. | Text2Infographic is an innovative AI-powered tool designed to streamline the creation of stunning visual infographics from raw text. It intelligently summarizes input content and generates relevant images, significantly reducing the time and effort typically required for graphic design. This platform empowers users, regardless of their design expertise, to transform complex information into engaging, easy-to-understand visuals for various communication needs. |
| What It Does | Ezinsights AI functions by allowing users to connect various data sources and then ask questions about their data using natural language. The platform leverages advanced NLP and GenAI to understand these queries, process the underlying data, and generate precise insights, reports, and actionable recommendations. It translates complex data into easily digestible formats, including interactive visualizations, enabling quick comprehension and strategic decision-making. | The tool's core functionality involves taking user-provided text, applying AI to summarize the key points, and then generating appropriate visual elements and layouts. Users can then extensively customize these AI-generated infographics, adjusting text, colors, fonts, icons, and overall design to match their brand or message, before exporting the final product. |
| Pricing Type | paid | freemium |
| Pricing Model | paid | freemium |
| Pricing Plans | Custom Enterprise Solution: Contact for Quote | Free: Free, Basic: 19, Pro: 39 |
| Rating | N/A | N/A |
| Reviews | N/A | N/A |
| Views | 11 | 19 |
| Verified | No | No |
| Key Features | Natural Language Querying, Multi-Source Data Integration, Instant Insights & Recommendations, Interactive Data Visualizations, Advanced AI Analytics | AI Content Summarization, AI Image Generation, Extensive Customization Options, Pre-designed Templates Library, Multiple Export Formats |
| Value Propositions | Democratizes Data Access, Accelerates Decision Making, Reduces Analytical Bottlenecks | Time-Saving Infographic Creation, No Design Skills Required, Transform Complex Information |
| Use Cases | Sales Performance Analysis, Marketing Campaign Effectiveness, Financial Health Monitoring, Customer Behavior Understanding, Supply Chain Optimization | Marketing Content Creation, Educational Material Development, Business Report Summarization, Research Findings Visualization, Social Media Visuals |
| Target Audience | This tool is ideal for business leaders, managers, and operational teams across various departments such as sales, marketing, finance, and supply chain. It specifically targets non-technical users who need quick, data-driven insights to make informed decisions without relying on data scientists or analysts, democratizing access to business intelligence. | This tool is ideal for marketers, content creators, educators, business professionals, and students who need to present data or complex information visually and efficiently. Anyone looking to create professional-looking infographics quickly, without extensive design skills, will find Text2Infographic highly beneficial. |
| Categories | Data Analysis, Business Intelligence, Analytics, Data Visualization | Text Summarization, Image Generation, Design, Data Visualization |
| Tags | business intelligence, data analysis, no-code ai, natural language processing, generative ai, ai analytics, data insights, business analytics, data democratization, decision intelligence | infographic generator, ai summarization, data visualization, visual content, content marketing, design tool, ai images, graphic design, text to image, presentation tool |
| GitHub Stars | N/A | N/A |
| Last Updated | N/A | N/A |
| Website | ezinsights.ai | text2infographic.com |
| GitHub | N/A | N/A |
Who is Ezinsights AI best for?
This tool is ideal for business leaders, managers, and operational teams across various departments such as sales, marketing, finance, and supply chain. It specifically targets non-technical users who need quick, data-driven insights to make informed decisions without relying on data scientists or analysts, democratizing access to business intelligence.
Who is Text2Infographic best for?
This tool is ideal for marketers, content creators, educators, business professionals, and students who need to present data or complex information visually and efficiently. Anyone looking to create professional-looking infographics quickly, without extensive design skills, will find Text2Infographic highly beneficial.